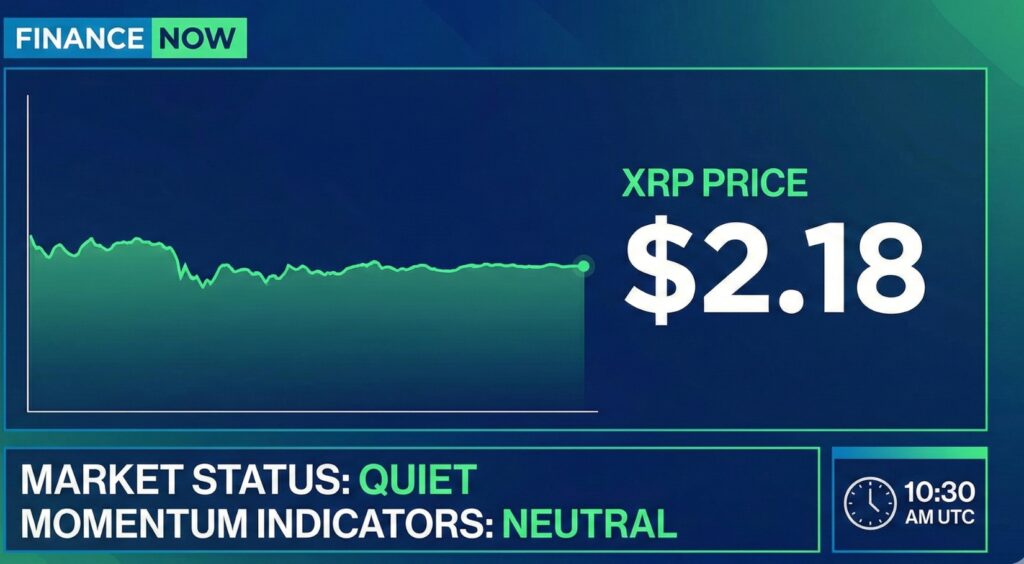
XRP is trading around $2.18 with very limited volatility, reflecting a market environment that currently lacks strong catalysts. Technical indicators also point toward a neutral trend, as the token continues to move within a narrow range and follows the broader slowdown seen across the crypto sector.
Key Snapshot
- Current Price: $2.18
- 24h Move: -0.4%
- No major news drivers or announcements
- Price fluctuating between $2.16 and $2.28
- Market sentiment remains cautious as traders await December developments
Market Context: What’s Influencing XRP Today?
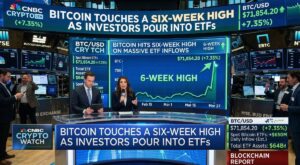
XRP’s recent movement reflects the overall calm across the cryptocurrency market. In the past week, there have been no major institutional updates, regulatory developments, or partnership announcements, leaving technical factors to guide price action.
With a mild 0.35% dip, XRP is mirroring the broader cautious sentiment as investors prepare for year-end adjustments. The token has stayed confined within a narrow intraday range, highlighting a market waiting for clearer signals.
Despite the sideways movement, spot trading volume on Binance remains high at around $287 million, indicating continued interest from bigger players—even as overall market activity cools toward late November.
XRP Technical Analysis: Neutral Momentum Inside a Tight Range
Price Positioning
XRP is trading just under its 20-day simple moving average (SMA) at $2.20, suggesting a neutral short-term trend.
Key moving averages:
- 7-day SMA: $2.18 – very close to the current price, showing no strong trend
- 50-day SMA: $2.34 – key resistance
- 200-day SMA: $2.62 – major long-term resistance
The price remains below the longer-term averages, meaning bulls still need strong momentum to flip the broader trend upward.
Key Technical Indicators
RSI — 46.48
Neutral zone, offering no immediate directional bias.
MACD — Mixed Signals
- MACD line: -0.0607
- Signal line: -0.0821
- Histogram: +0.0213
The positive histogram hints at early bullish momentum, though still weak.
Stochastic — Near Overbought
- %K: 74.61
- %D: 73.69
Suggests the token is close to overbought within its current range.
Bollinger Bands
XRP sits in the lower half of the band structure, showing potential for movement back toward the middle band near $2.20 before meeting resistance
Key Price Levels to Watch
Short-Term Levels (Next 24–48 Hours)
- Immediate resistance: $2.28
- Immediate support: $2.16
Breakout Scenarios
- Bullish: Breaking above $2.28 opens a path toward the 20-day SMA (near $2.20) and then the stronger resistance area at $2.58 – $2.70.
- Bearish: Losing $2.16 could push XRP toward $1.82, where previous consolidation and the lower Bollinger Band (around $1.92) align.
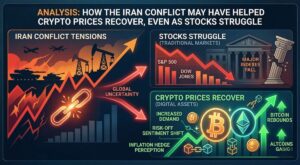
Correlation Overview
- Bitcoin: XRP continues to follow Bitcoin’s small pullback with no major divergence.
- Traditional markets: Minimal correlation as both markets remain quiet.
- Altcoins: Most major altcoins are also consolidating, mirroring XRP’s pattern.
Short-Term Outlook for Ripple (XRP)
Bullish Potential
If XRP successfully breaks $2.28 with strong trading volume, momentum could quickly carry the price toward $2.58. The positive MACD histogram suggests there is early bullish pressure building beneath the surface.
Bearish Risk
If the token falls below $2.16, a deeper correction toward $1.82 becomes more likely—especially if Bitcoin weakens further or traditional risk markets experience selling pressure.
XRP’s position below the 50-day and 200-day averages adds vulnerability to market-wide declines.
Risk Management Considerations
- Conservative traders may set stop-loss levels below $2.10 to manage downside exposure.
With an ATR of $0.14, XRP’s daily volatility currently sits around 6–7%, which should be factored into position sizing.